

GST collections breach landmark milestone of ₹2 lakh crore
Gross Revenue Records 12.4% y-o-y growth
Net Revenue (after refunds) stood at ₹1.92 lakh crore; 15.5% y-o-y growth
The Gross Goods and Services Tax (GST) collections hit a record high in April 2024 at ₹2.10 lakh crore. This represents a significant 12.4% year-on-year growth, driven by a strong increase in domestic transactions (up 13.4%) and imports (up 8.3%). After accounting for refunds, the net GST revenue for April 2024 stands at ₹1.92 lakh crore, reflecting an impressive 15.5% growth compared to the same period last year.
Positive Performance Across Components:
Breakdown of April 2024 Collections:
- Central Goods and Services Tax (CGST): ₹43,846 crore;
- State Goods and Services Tax (SGST): ₹53,538 crore;
- Integrated Goods and Services Tax (IGST): ₹99,623 crore, including ₹37,826 crore collected on imported goods;
- Cess: ₹13,260 crore, including ₹1,008 crore collected on imported goods.
Inter-Governmental Settlement: In the month of April, 2024, the central government settled ₹50,307 crore to CGST and ₹41,600 crore to SGST from the IGST collected. This translates to a total revenue of ₹94,153 crore for CGST and ₹95,138 crore for SGST for April, 2024 after regular settlement.
The chart below shows trends in monthly gross GST revenues during the current year. Table-1 shows the state-wise figures of GST collected in each State during the month of April, 2024 as compared to April, 2023. Table-2 shows the state-wise figures of post settlement GST revenue of each State for the month of April, 2024.
Chart: Trends in GST Collection
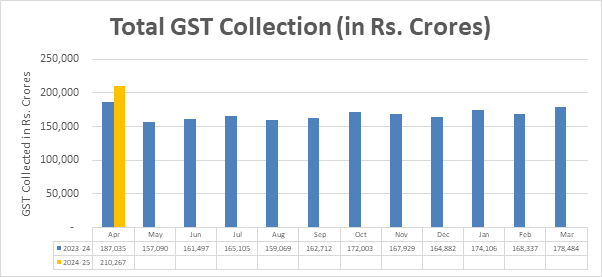
Table 1: State-wise growth of GST Revenues during April, 2024[1]
| State/UT | Apr-23 | Apr-24 | Growth (%) |
| Jammu and Kashmir | 803 | 789 | -2% |
| Himachal Pradesh | 957 | 1,015 | 6% |
| Punjab | 2,316 | 2,796 | 21% |
| Chandigarh | 255 | 313 | 23% |
| Uttarakhand | 2,148 | 2,239 | 4% |
| Haryana | 10,035 | 12,168 | 21% |
| Delhi | 6,320 | 7,772 | 23% |
| Rajasthan | 4,785 | 5,558 | 16% |
| Uttar Pradesh | 10,320 | 12,290 | 19% |
| Bihar | 1,625 | 1,992 | 23% |
| Sikkim | 426 | 403 | -5% |
| Arunachal Pradesh | 238 | 200 | -16% |
| Nagaland | 88 | 86 | -3% |
| Manipur | 91 | 104 | 15% |
| Mizoram | 71 | 108 | 52% |
| Tripura | 133 | 161 | 20% |
| Meghalaya | 239 | 234 | -2% |
| Assam | 1,513 | 1,895 | 25% |
| West Bengal | 6,447 | 7,293 | 13% |
| Jharkhand | 3,701 | 3,829 | 3% |
| Odisha | 5,036 | 5,902 | 17% |
| Chhattisgarh | 3,508 | 4,001 | 14% |
| Madhya Pradesh | 4,267 | 4,728 | 11% |
| Gujarat | 11,721 | 13,301 | 13% |
| Dadra and Nagar Haveli and Daman & Diu | 399 | 447 | 12% |
| Maharashtra | 33,196 | 37,671 | 13% |
| Karnataka | 14,593 | 15,978 | 9% |
| Goa | 620 | 765 | 23% |
| Lakshadweep | 3 | 1 | -57% |
| Kerala | 3,010 | 3,272 | 9% |
| Tamil Nadu | 11,559 | 12,210 | 6% |
| Puducherry | 218 | 247 | 13% |
| Andaman and Nicobar Islands | 92 | 65 | -30% |
| Telangana | 5,622 | 6,236 | 11% |
| Andhra Pradesh | 4,329 | 4,850 | 12% |
| Ladakh | 68 | 70 | 3% |
| Other Territory | 220 | 225 | 2% |
| Center Jurisdiction | 187 | 221 | 18% |
| Grand Total | 1,51,162 | 1,71,433 | 13% |
Table-2: SGST & SGST portion of IGST settled to States/UTs
April (Rs. in crore)
| Pre-Settlement SGST | Post-Settlement SGST[2] | |||||
| State/UT | Apr-23 | Apr-24 | Growth | Apr-23 | Apr-24 | Growth |
| Jammu and Kashmir | 394 | 362 | -8% | 918 | 953 | 4% |
| Himachal Pradesh | 301 | 303 | 1% | 622 | 666 | 7% |
| Punjab | 860 | 999 | 16% | 2,090 | 2,216 | 6% |
| Chandigarh | 63 | 75 | 20% | 214 | 227 | 6% |
| Uttarakhand | 554 | 636 | 15% | 856 | 917 | 7% |
| Haryana | 1,871 | 2,172 | 16% | 3,442 | 3,865 | 12% |
| Delhi | 1,638 | 2,027 | 24% | 3,313 | 4,093 | 24% |
| Rajasthan | 1,741 | 1,889 | 9% | 3,896 | 3,967 | 2% |
| Uttar Pradesh | 3,476 | 4,121 | 19% | 7,616 | 8,494 | 12% |
| Bihar | 796 | 951 | 19% | 2,345 | 2,688 | 15% |
| Sikkim | 110 | 69 | -37% | 170 | 149 | -12% |
| Arunachal Pradesh | 122 | 101 | -17% | 252 | 234 | -7% |
| Nagaland | 36 | 41 | 14% | 107 | 111 | 4% |
| Manipur | 50 | 53 | 6% | 164 | 133 | -19% |
| Mizoram | 41 | 59 | 46% | 108 | 132 | 22% |
| Tripura | 70 | 80 | 14% | 164 | 198 | 21% |
| Meghalaya | 69 | 76 | 9% | 162 | 190 | 17% |
| Assam | 608 | 735 | 21% | 1,421 | 1,570 | 10% |
| West Bengal | 2,416 | 2,640 | 9% | 3,987 | 4,434 | 11% |
| Jharkhand | 952 | 934 | -2% | 1,202 | 1,386 | 15% |
| Odisha | 1,660 | 2,082 | 25% | 2,359 | 2,996 | 27% |
| Chhattisgarh | 880 | 929 | 6% | 1,372 | 1,491 | 9% |
| Madhya Pradesh | 1,287 | 1,520 | 18% | 2,865 | 3,713 | 30% |
| Gujarat | 4,065 | 4,538 | 12% | 6,499 | 7,077 | 9% |
| Dadra and Nagar Haveli and Daman and Diu | 62 | 75 | 22% | 122 | 102 | -16% |
| Maharashtra | 10,392 | 11,729 | 13% | 15,298 | 16,959 | 11% |
| Karnataka | 4,298 | 4,715 | 10% | 7,391 | 8,077 | 9% |
| Goa | 237 | 283 | 19% | 401 | 445 | 11% |
| Lakshadweep | 1 | 0 | -79% | 18 | 5 | -73% |
| Kerala | 1,366 | 1,456 | 7% | 2,986 | 3,050 | 2% |
| Tamil Nadu | 3,682 | 4,066 | 10% | 5,878 | 6,660 | 13% |
| Puducherry | 42 | 54 | 28% | 108 | 129 | 19% |
| Andaman and Nicobar Islands | 46 | 32 | -32% | 78 | 88 | 13% |
| Telangana | 1,823 | 2,063 | 13% | 3,714 | 4,036 | 9% |
| Andhra Pradesh | 1,348 | 1,621 | 20% | 3,093 | 3,552 | 15% |
| Ladakh | 34 | 36 | 7% | 55 | 61 | 12% |
| Other Territory | 22 | 16 | -26% | 86 | 77 | -10% |
| Grand Total | 47,412 | 53,538 | 13% | 85,371 | 95,138 | 11% |
[1]Does not include GST on import of goods
[2] Post-Settlement GST is cumulative of the GST revenues of the States/UTs and the SGST portion of the IGST settled to the States/UTs
